Coolie Data Viz

Exploring the Coolie Trade of the 19th Century using data visualization.

Filtering by Category: model

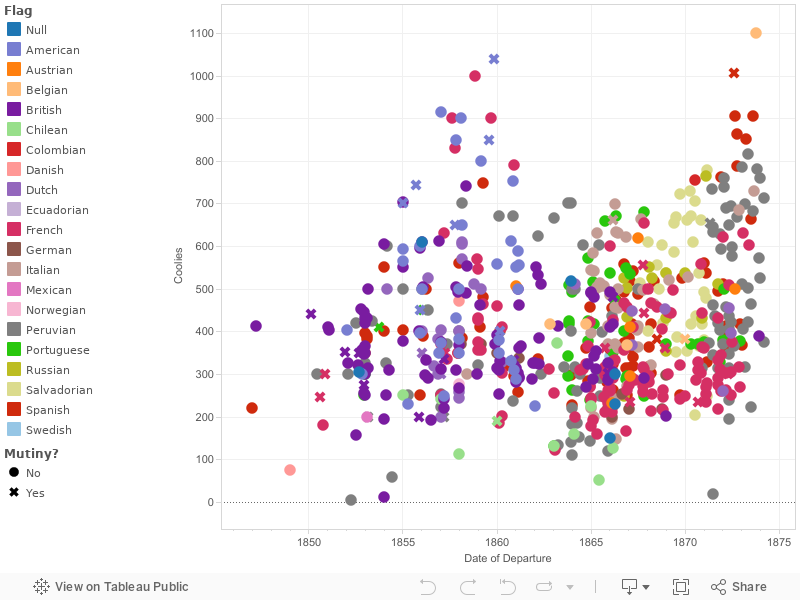
Coolie Ship Scatter Plot

This scatter plot shows all of the (documenteD) ships that transported coolies to Latin America during the Coolie Trade. Each ship is represented by a data point, which is color coded by the flag the ship flew. Those ships that experienced mutinies are shaped differently. The ship's position on the y axis is based on the number of coolies it was transporting.

Those ships that did not have information on the number of coolies they were transporting have been excluded. Those ships that did not provide a specific month for their departure have been set to January 1 of their respective year.

Additional information on each ship, including its name, the flag it flew, the year it sailed, the number of coolie it transported, and its mutiny status is available when hovering over each data point.


Raw data from Meagher, Arnold J. 2008. The Coolie Trade : The Traffic in Chinese Laborers to Latin America, 1847-1874. Xlibris Corporation.

Coolie Volume Packed Bubble

This is a visual, created with Tableau Public, showing the breakdown of coolies transported by nation (or the flag that the ship flew).

An interesting takeaway from this visualization is the fact that so many different nations contributed to the transport of coolie laborers to relatively few destination countries (primarily Cuba and Peru). The fact that the transport of coolies was distributed among different countries made it difficult for the Chinese government to regulate and end the trade. For example, after drafting regulations known as the Peking Regulations of 1866, which dealt with how coolies could be transported and treated in their destination countries, the Chinese government was successful in getting several countries, including the US, Germany, and Russia, to adopt the regulations. However, they failed to get Spain, Britain, and France to adopt the regulations. As one can see from the visualization below, failing to secure these three nations' agreement meant leaving out a significant slice of coolie traffic that would continue to be relatively unregulated.

Visualizations like this one can help to frame the efficacy of certain laws or regulations passed by the Chinese government at the time. Due to the various international players in the Coolie Trade, breakdowns on the data like the one below are critical to framing the history accurately.

Raw data from Meagher, Arnold J. 2008. The Coolie Trade : The Traffic in Chinese Laborers to Latin America, 1847-1874. Xlibris Corporation.

Coolie Volume by Year/Nation

This model shows the composition of coolies shipped by the flag the ship flew and by the number of coolies being transported. This helps to show the increase in volume of the Coolie Trade and the changing composition of those nations involved in the trade.

For example, by clicking on the American label on the Legend, it becomes clear that American involvement in the Coolie Trade ended in 1862. In this year, the American Congress passed An act to prohibit the "coolie trade" by American citizens in American vessels, which prohibited the transport of coolies on any ships owned or operated by American citizens. Prior to the passage of this law, American ships had been heavily involved in the Coolie Trade, which was problematic for many Americans due to the parallels between the Coolie Trade and the African Slave Trade of the earlier half of the 19th Century. The full text of the 1862 Anti-Coolie Law can be found here.

Raw data from Meagher, Arnold J. 2008. The Coolie Trade : The Traffic in Chinese Laborers to Latin America, 1847-1874. Xlibris Corporation.

Coolie Emigration Flow

These "Alluvial Flow" models show the composition of the flow of coolie laborers from their chinese port of origin to their various destinations in latin america. the thickness of the lines indicate the number/volume of coolies transported.

The significance of these models is twofold.

  1. First, they shows that the vast majority of Chinese laborers were destined for Peru or Cuba.
  2. Second, they shows that the vast majority of those Chinese laborers transported were processed through the port of Macao, which was a Portuguese-controlled territory during the Coolie Trade and long after its demise.

Thus, these models help to visually explain why the Chinese government was so limited in its control over the trade, since so many coolies were transported out of ports that they did not have jurisdiction in. Canton and Hong Kong also fall under this category of ports outside direct Chinese control. These models also include less significant ports of departure and arrival and help to frame departure and arrival locations in terms of transportation volume side-by-side. 

410Brazil 0BrazilBritish Guiana 14,747British GuianaCosta Rica 685Costa RicaCuba 143,471CubaHondouras 480HondourasJamaica 515JamaicaMartinique 781MartiniquePanama 0PanamaPeru 104,913PeruSouth America 0South AmericaSurinam 2,861SurinamTrinidad 2,787Trinidad 0Amoy 11,323AmoyBatavia 270BataviaCanton 13,262CantonCumsingmoon 4,937CumsingmoonHong Kong 10,532Hong KongMacao 206,469MacaoNingpo 0NingpoPanama 205PanamaShanghai 855ShanghaiSingapore 0SingaporeSwatow 23,797Swatow

This second Alluvial model, while much busier and complex, maintains the relative clarity of the Port of Departure and Destination country's volume but causes the flow lines to pass through a 3rd variable (Year). This allows one to see the volume of each year relative to the total volume of coolies being transported. What is lost in this 3 dimension flow is the direct relationships between Port of Departure and Destination Country. The total volume leaving a Port and arriving in a country is preserved, but one can no longer determine the amount of coolies transported from Macao to Cuba, for example. But we can now see which years had the most transport volume and how each port of departure and destination contributed to the volume in a given year.

410Brazil 0BrazilBritish Guiana 14,747British GuianaCosta Rica 685Costa RicaCuba 143,471CubaHondouras 480HondourasJamaica 515JamaicaMartinique 781MartiniquePanama 0PanamaPeru 104,913PeruSouth America 0South AmericaSurinam 2,861SurinamTrinidad 2,787Trinidad 0Amoy 11,323AmoyBatavia 270BataviaCanton 13,262CantonCumsingmoon 4,937CumsingmoonHong Kong 10,532Hong KongMacao 206,469MacaoNingpo 0NingpoPanama 205PanamaShanghai 855ShanghaiSingapore 0SingaporeSwatow 23,797Swatow1847 63218471849 7518491850 1,46518501851 1,16518511852 5,96618521853 6,73718531854 3,80218541855 8,76018551856 9,16618561857 13,75718571858 13,83818581859 10,20018591860 11,42718601861 7,67318611862 4,83918621863 7,79018631864 11,31618641865 18,14718651866 27,45018661867 16,35518671868 12,65718681869 9,63618691870 13,82618701871 17,54918711872 21,63918721873 13,41218731874 2,3711874

Raw data from Meagher, Arnold J. 2008. The Coolie Trade : The Traffic in Chinese Laborers to Latin America, 1847-1874. Xlibris Corporation.