Coolie Volume Packed Bubble
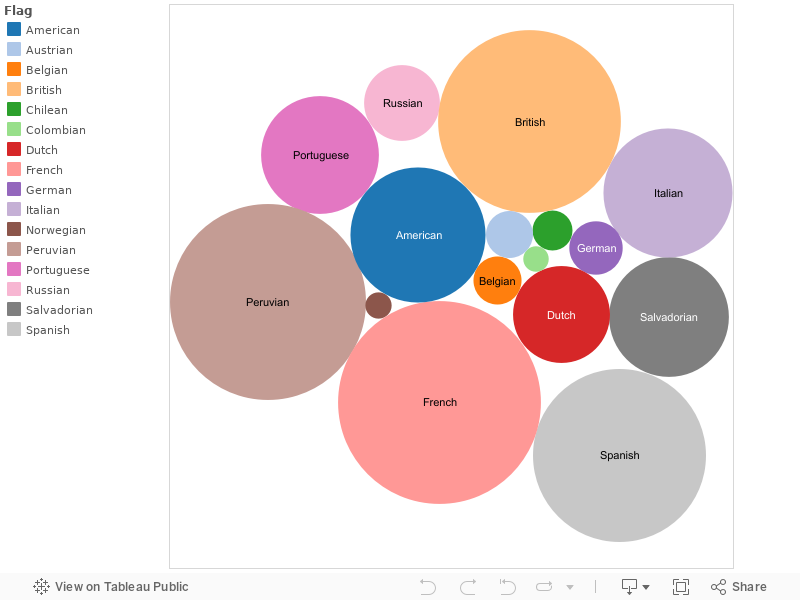
This is a visual, created with Tableau Public, showing the breakdown of coolies transported by nation (or the flag that the ship flew).
An interesting takeaway from this visualization is the fact that so many different nations contributed to the transport of coolie laborers to relatively few destination countries (primarily Cuba and Peru). The fact that the transport of coolies was distributed among different countries made it difficult for the Chinese government to regulate and end the trade. For example, after drafting regulations known as the Peking Regulations of 1866, which dealt with how coolies could be transported and treated in their destination countries, the Chinese government was successful in getting several countries, including the US, Germany, and Russia, to adopt the regulations. However, they failed to get Spain, Britain, and France to adopt the regulations. As one can see from the visualization below, failing to secure these three nations' agreement meant leaving out a significant slice of coolie traffic that would continue to be relatively unregulated.
Visualizations like this one can help to frame the efficacy of certain laws or regulations passed by the Chinese government at the time. Due to the various international players in the Coolie Trade, breakdowns on the data like the one below are critical to framing the history accurately.
Raw data from Meagher, Arnold J. 2008. The Coolie Trade : The Traffic in Chinese Laborers to Latin America, 1847-1874. Xlibris Corporation.